
One common concern for developers, system administrators, or anyone working with PHP-FPM (FastCGI Process Manager) is memory usage. Memory management is a critical aspect of maintaining an efficient, reliable, and responsive application. One of the tools that can be instrumental in analyzing memory usage of PHP-FPM workers is pmap. pmap is a utility provided by most Unix-based systems that displays detailed information about memory usage.
Let’s dive into how to use pmap to analyze memory usage of PHP-FPM workers.
What is pmap?
pmap is a Linux command-line utility that reports the memory map of a process. The tool provides a comprehensive breakdown of a process’s memory usage, showing you the amount of memory consumed by individual segments like the stack, heap, anonymous memory mappings, and loaded shared libraries.
Step 1: Identify PHP-FPM Worker Processes
First, you need to identify the process IDs (PIDs) of the PHP-FPM worker processes. This can be done using the ps command. The command to get the PIDs of PHP-FPM worker processes might look something like this:
ps aux | grep '[p]hp-fpm: pool www'In this command, ps aux lists all running processes. The grep command filters out only the PHP-FPM worker processes. The [p] is a trick to exclude the grep command itself from the process list.
Step 2: Analyze Memory Usage with pmap
Once you have the PIDs, you can pass them to the pmap command. This is done using the following command:
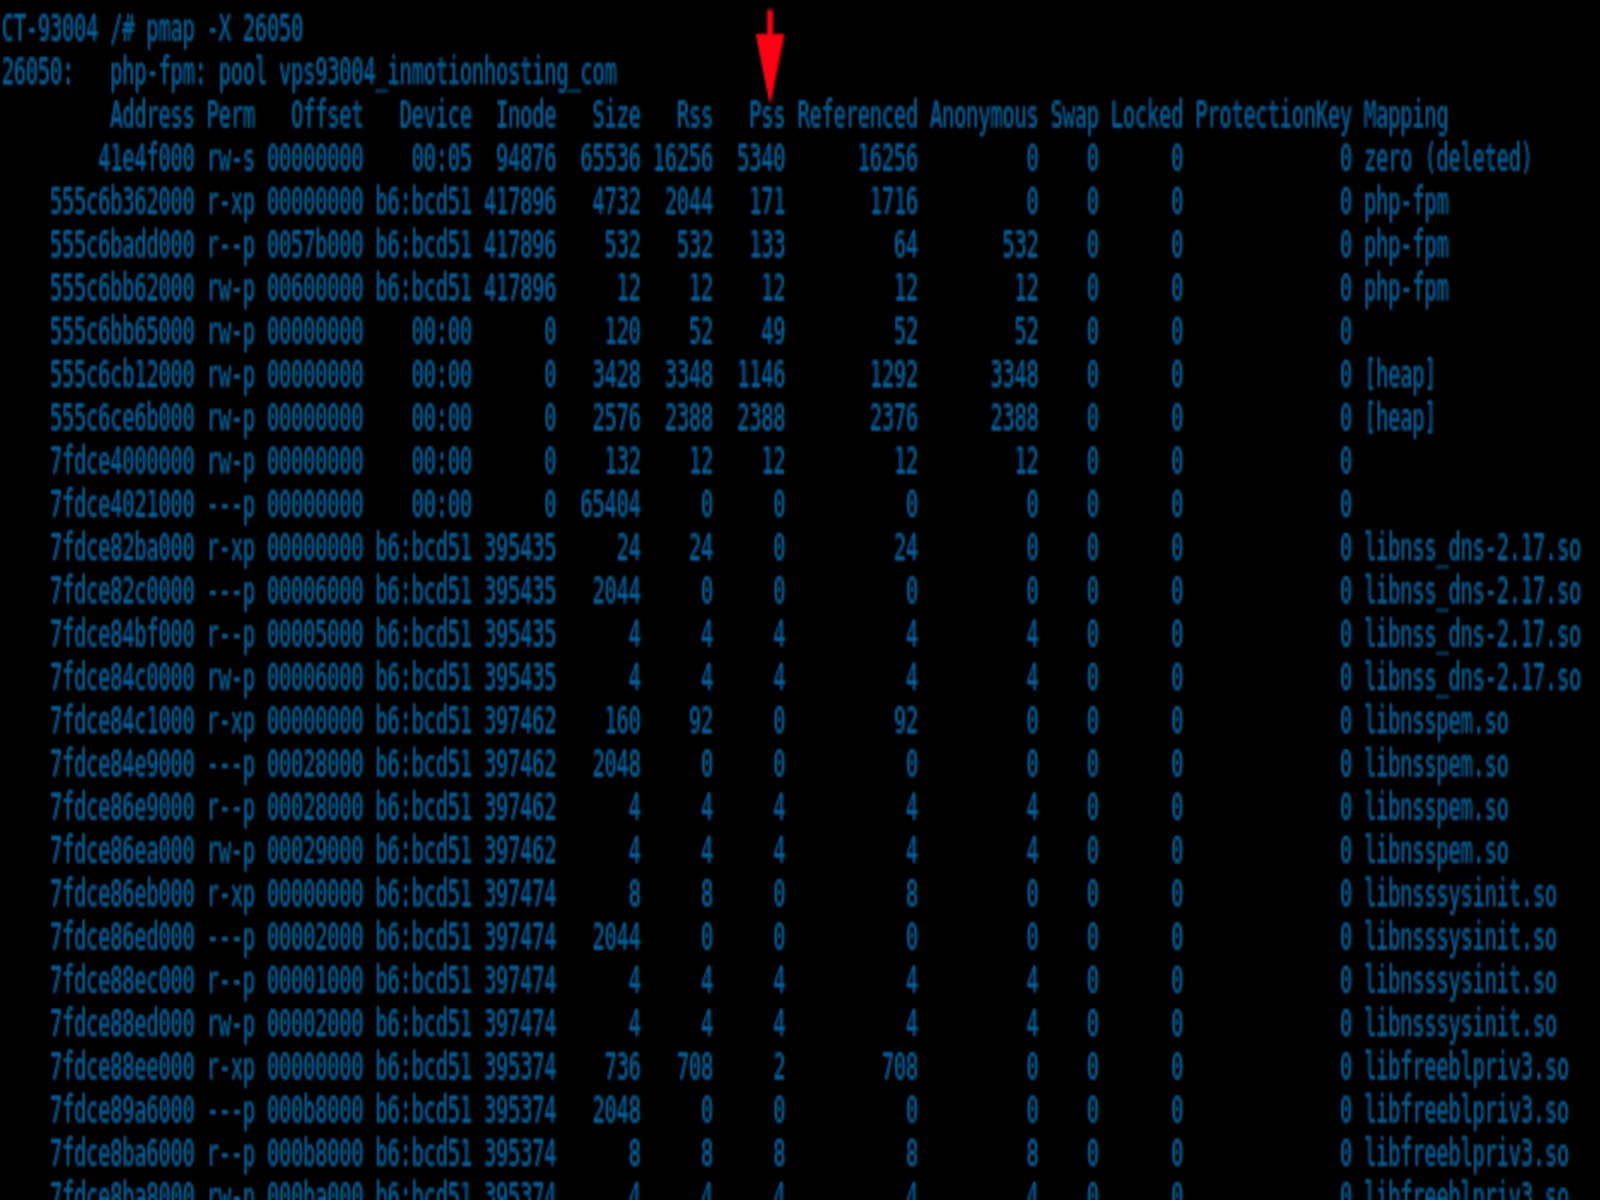
pmap -x [PID]This command displays the memory map of the process with the given PID. The -x option instructs pmap to provide extended format output, which includes the size, RSS (Resident Set Size), dirty size, and mode of each mapped region.
The output will be a detailed list of all memory allocations for the PHP-FPM process, including shared and private memory segments. Here’s an example:
Address           Kbytes     RSS   Dirty Mode   Mapping
000055a968a5c000     136     136     136 r-x-- php-fpm7.4
000055a968a7c000       4       4       4 r---- php-fpm7.4
000055a968a7d000       4       4       4 rw--- php-fpm7.4
...
----------------  ------  ------  ------
total kB            65280   20684   14992
In this example, ‘Kbytes’ is the total amount of memory allocated for that particular segment, ‘RSS’ is the portion of that memory which is currently held in RAM, and ‘Dirty’ is the portion of the ‘RSS’ that is currently being used.
Step 3: Interpret pmap Results
The result of the pmap command will provide you with insight into how your PHP-FPM workers are using memory.
The line with the total kB gives a sum of the Kbytes, RSS, and Dirty columns. This can give you a sense of how much memory your PHP-FPM workers are consuming in total (Kbytes), how much of that memory is in active use (RSS), and how much of that active memory is being used for data rather than program code (Dirty).
Each individual line of the pmap output represents a different segment of memory. The ‘Mode’ column can help you understand what each segment is used for. For example, ‘r-x’ means that segment is readable and executable (probably program code), while ‘rw’ means it is readable and writable (probably data).
Understanding this output will help you identify potential memory leaks or unnecessarily large memory usage.
Remember, consistently high memory usage may not necessarily indicate a problem. PHP-FPM uses a technique known as ‘copy-on-write’ to reduce the amount of memory each worker process needs. Shared memory segments may appear in each worker’s memory map, but they are only duplicated in RAM if a worker needs to modify them.
However, if you notice an unexpectedly large amount of private (non-shared) memory usage, or if memory usage increases over time without decreasing, you might be dealing with a memory leak. These problems can often be addressed by modifying your PHP code or adjusting your PHP-FPM configuration.
By utilizing pmap to analyze PHP-FPM worker memory usage, you can keep your applications running smoothly and efficiently, and identify potential problems before they become critical. It’s a powerful tool that, when used correctly, can provide essential insights into your PHP-FPM workers’ memory usage.
What does an “s” mean in the mode column of pmap output?
When you see an ‘s’ in the Mode column, it indicates that the specific memory region is shared with other processes. Shared memory is an efficient way for process communication or for avoiding copying data between processes.
Typically, you may see memory segments shared between different instances of the same program (for instance, different worker processes in PHP-FPM) or between a program and a shared library that it uses.
Understanding whether a memory region is shared or private is important when you are trying to assess the overall memory usage of your system. Shared memory regions count towards the memory usage of each process that shares them, but they only need to be stored in RAM once, no matter how many processes share them.
As a result, the total memory usage of your system could be less than the sum of the memory usage of all individual processes, due to these shared regions.
How to total the memory usage of php-fpm workers on a server, but also take in to account shared memory maps?
Totaling the memory usage of PHP-FPM workers while taking into account shared memory maps requires a multi-step approach. Keep in mind that accurate memory usage is challenging to determine due to shared memory, especially with PHP-FPM’s copy-on-write mechanism.
You can use pmap to list memory maps, but interpreting the data and extracting meaningful results manually can be challenging. Instead, you can leverage Linux’s smem utility. smem is a tool that provides numerous reports on memory usage on Linux systems, and unlike traditional tools, it can account for shared memory.
Follow these steps to install and use `smem:
Step 1: Install smem
The first step is to install smem on your server. On a Ubuntu/Debian server, you can install smem using the following command:
apt-get install smemFor CentOS or similar, use:
yum install smemStep 2: Use smem to Analyze PHP-FPM Memory Usage
Now, you can use smem to get a report on the memory usage of your PHP-FPM workers. Use the following command:
smem -r | grep php-fpmThis will give you an output similar to the following:
code  PID User     Command                         Swap      USS      PSS      RSS
12345 www-data php-fpm: pool www                 0    20572    20572    20572
12346 www-data php-fpm: pool www                 0    20480    20480    20480
12347 www-data php-fpm: pool www                 0    20588    20588    20588
In this output, the columns stand for:
- USS (Unique Set Size): The unshared memory that is unique to a process.
- PSS (Proportional Set Size): The amount of memory shared with other processes, accounted in a way that the amount is divided evenly between the processes using it.
- RSS (Resident Set Size): The non-swapped physical memory used by a process.
In this context, PSS is probably the most meaningful number. It’s a middle ground that accounts for shared memory.
To get the total PSS memory usage of all PHP-FPM processes, you can use a command like:
smem -r --columns pss | grep php-fpm | awk '{sum += $1} END {print sum}'This command uses awk to sum the PSS values (which are in the fifth column of smem output) of all the PHP-FPM worker processes and print the total.
With these steps, you can get an approximation of the total memory usage of PHP-FPM workers, taking shared memory into account.
Why does a fpm worker allocate 65536 Kbytes to /dev/zero of shared memory?
The allocation of shared memory to /dev/zero by an FPM worker generally happens when it creates a shared memory segment.
Shared memory allows processes to communicate and share data without the overhead of inter-process communication (IPC) or data copying. The shared memory object, in this case, is created using /dev/zero, a special file in Unix-like operating systems that produces null bytes when read, and discards data when written to.
When an FPM worker allocates a shared memory segment, it reserves a specific amount of system memory for shared use between itself and other worker processes. This allocation is represented in pmap or similar tools as a mapping to /dev/zero.
The allocation size of 65536 Kbytes is likely the default size for shared memory segments in the PHP-FPM configuration. This size can be changed in the PHP-FPM configuration file.
It’s important to note that this reserved memory isn’t “used” in the same sense as memory consumed by a running process or stored data. Rather, it’s set aside by the operating system to facilitate shared memory communication between processes.
That said, if you’re seeing an unexpected amount of memory being allocated to /dev/zero, it could indicate an issue with your application or PHP-FPM configuration, so it’s always good to monitor and understand these memory allocations.